
The Half-Year in One Sentence
H1 2026 was a global equity market defined by one structural thesis — the AI hardware buildout — interrupted by one geopolitical shock — the Iran war and Strait of Hormuz closure — and resolved by one diplomatic event — the US-Iran peace deal of June 14. Everything else was secondary.
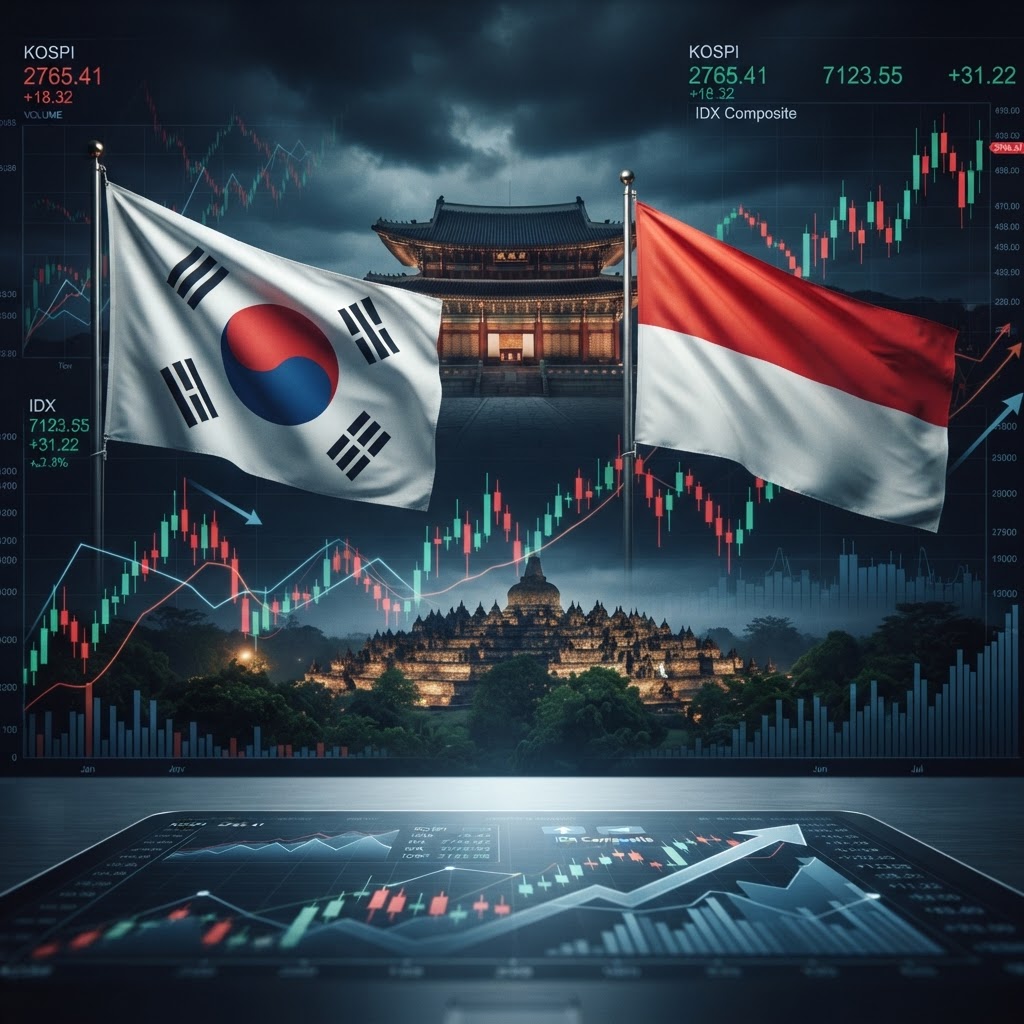
The MSCI ACWI (ACWI) returned +10.45% in H1 2026. The S&P 500 (SPY) returned +9.54%. Both numbers are respectable but mask the most extreme dispersion in global equity market performance since at least 2008. South Korea's iShares MSCI South Korea ETF (EWY) returned +92.24%. Indonesia's iShares MSCI Indonesia ETF (EIDO) lost -39.55%. The gap between the best and worst country ETF in H1 2026: 131.8 percentage points in a single six-month period.
The Five Acts of H1 2026
H1 2026 did not unfold as a single trend. It played out in five distinct acts, each with its own set of winners and losers.
(1) The AI Ignition (January–February 27). The year opened with the global AI infrastructure buildout already in full acceleration. Microsoft, Google, Amazon and Meta had collectively committed approximately $720 billion in AI capital expenditure for 2026 — up from $415 billion in 2025, a 74% annual increase. Every dollar of that capex flowed into data centres. Data centres required Nvidia GPUs. Nvidia GPUs required TSMC to manufacture the logic dies and SK Hynix or Samsung to supply the HBM (High Bandwidth Memory). South Korea and Taiwan opened the year already leading the global equity leaderboard.
(2) The Iran War Shock (February 27 – April). On February 27, the US-Israeli military campaign against Iran began. The Strait of Hormuz — through which approximately 20% of global oil trade transits — was closed. Brent crude surged above $90, then above $100. The immediate impact: energy exporters surged (Norway's ENOR peaked at +32% YTD), energy importers collapsed (Indonesia's EIDO fell -36% from the war start, South Africa's EZA lost -22.9%, Brazil's EWZ lost -11.8%). The global equity map was restructured around a single commodity: oil.
(3) The AI Trade Double-Down (March–May). Despite the Iran war, the AI semiconductor trade did not pause. EWY peaked at +120% YTD in late May. Samsung reported all-time-high quarterly revenue of approximately $89 billion. SK Hynix reported record quarterly revenue of approximately $35 billion. TSMC's Q1 2026 revenue reached $35.9 billion with a gross margin of 66.2%. Hyperscaler capex commitments did not flinch. The market was delivering a message: the AI buildout is not a cycle — it is a structural shift. HBM contracts moved from 3-6 month pricing to 3-5 year cycles, permanently changing the earnings visibility for Korean memory companies.
(4) The Latin American Political Re-Rating (June 1–21). Two simultaneous political events added a third narrative layer to H1 2026. On June 1, far-right outsider Abelardo de la Espriella won Colombia's presidential first round, triggering a +8.8% single-session surge in COLO — its best day since March 2020. On June 7, Peru held its presidential runoff between conservative Keiko Fujimori and leftist Roberto Sánchez. Both markets ran the "Milei trade" — the pattern first established by Argentina's 2023 political re-rating in which a right-wing outsider wins in a deeply discounted market, triggering immediate multiple expansion. De la Espriella confirmed his victory on June 20-21.
(5) The Hormuz Reopening and Oil Glut (June 14–30). On June 14, Trump announced the deal with Iran. "Let the oil flow." Polymarket's permanent peace deal probability surged from 5.5% on June 1 to 100% confirmed by June 30. Brent crude fell more than 25% from its April peak to approximately $81. The IEA warned of a global oil supply glut. Norway's ENOR — which had been the dominant long trade of 2026 — crashed, ending H1 at +8.77% YTD and -9.16% since the war began. The entire oil trade reversed in six weeks.
Country ETF Rankings: The Full H1 2026 Scorecard
Top 10 Performers
| Rank | Country | ETF | H1 Return | Fwd P/E | Driver |
|---|---|---|---|---|---|
| 1 | 🇰🇷 South Korea | EWY | +92.24% | 8.3x | AI HBM — Samsung, SK Hynix |
| 2 | 🇹🇼 Taiwan | EWT | +66.24% | 22.7x | AI logic — TSMC monopoly |
| 3 | 🇳🇱 Netherlands | EWN | +19.53% | 20.9x | AI equipment — ASML, Nebius, BESI |
| 4 | 🇹🇭 Thailand | THD | +19.42% | 14.2x | AI data centre power — Delta Electronics |
| 5 | 🇨🇴 Colombia | COLO | +17.97% | 8.5x | Political re-rating — De la Espriella |
| 6 | 🇦🇹 Austria | EWO | +17.85% | 10.5x | AI substrate — AT&S |
| 7 | 🇵🇪 Peru | EPU | +15.43% | 10.2x | Political + copper |
| 8 | 🇯🇵 Japan | EWJ | +15.39% | 15.8x | SoftBank AI, BoJ reform |
| 9 | 🇬🇷 Greece | GREK | +14.88% | 9.5x | Banking re-rating, fiscal recovery |
| 10 | 🇹🇷 Turkey | TUR | +14.03% | 6.7x | Value re-rating, regional trade |
The dominant pattern in the top 10 is unmistakable. Seven of the ten best-performing country ETFs carry direct or indirect AI supply chain exposure. Korea and Taiwan are the logic chip and HBM layer. Netherlands is the semiconductor equipment layer (ASML's EUV machines, Nebius's AI cloud, BESI's die bonding). Thailand is the data centre power supply layer (Delta Electronics). Austria is the IC substrate layer (AT&S). Japan is the semiconductor equipment customer (Tokyo Electron, Advantest) and the AI investment platform layer (SoftBank). Every node in the AI hardware supply chain has a country ETF expression.
The exceptions — Colombia, Peru, Greece, Turkey — represent a secondary H1 2026 theme: deep-value political re-rating. All four were priced at extreme discounts to global benchmarks (Korea 8.3x, Colombia 8.5x, Greece 9.5x, Turkey 6.7x), all four had identifiable catalysts (elections in Colombia and Peru, fiscal credibility in Greece, value normalisation in Turkey) and all four ran a version of the same trade: extreme discount + identifiable catalyst = re-rating.
Bottom 10 Performers
| Rank | Country | ETF | H1 Return | Fwd P/E | Primary Cause |
|---|---|---|---|---|---|
| 1 | 🇮🇩 Indonesia | EIDO | -39.55% | 13.2x | Iran war oil shock + rupiah collapse |
| 2 | 🇨🇳 China | GXC | -9.26% | 10.2x | AI supply chain absence + geopolitics |
| 3 | 🇮🇳 India | INDA | -8.95% | 20.06x | FII outflows + overvaluation + oil |
| 4 | 🇿🇦 South Africa | EZA | -8.55% | 8.62x | Energy importer + commodity miss |
| 5 | 🇰🇼 Kuwait | KWT | -4.91% | 13.5x | Geopolitical proximity + oil reversal |
| 6 | 🇶🇦 Qatar | QAT | -3.60% | 11.8x | Geopolitical proximity + oil reversal |
| 7 | 🇩🇪 Germany | EWG | -3.00% | 14.6x | Legacy auto, chemicals, energy-intensive |
| 8 | 🇵🇭 Philippines | EPHE | -2.97% | 11.5x | Oil importer, currency pressure |
| 9 | 🇻🇳 Vietnam | VNM | -2.86% | [DATA UNAVAILABLE] | Trade disruption, energy costs |
| 10 | 🇩🇰 Denmark | EDEN | -2.59% | 21.5x | Novo Nordisk headwinds, most expensive DM |
Indonesia's -39.55% is the starkest damage in the laggard list. The country imports approximately 85-90% of its oil and its equity market was uniquely vulnerable to the Hormuz closure: every transmission channel — energy costs, currency, current account, capital flight — operated simultaneously and in the same direction. Post-Hormuz deal, Indonesia's valuation has already partially repriced (EIDO P/E rose to 13.2x from 9.36x earlier in the year as the recovery began) but remains the deepest scar from H1 2026's geopolitical shock.
India's -8.95% is analytically distinct from Indonesia's. India's decline was primarily driven by $53+ billion in foreign institutional investor outflows — capital rotating from a 20.06x P/E market into Korean and Taiwanese AI exposure at 8.3x and 22.7x respectively. The Iran war amplified the pain through oil costs, but FII rotation was the structural driver.
Germany's -3.00% in a year when European peers like Spain (+9.09%), Austria (+17.85%) and Netherlands (+19.53%) rallied strongly encapsulates Germany's structural problem: the wrong industry exposure (legacy auto, BASF chemicals, energy-intensive manufacturing) in a market cycle rewarding AI supply chain exposure.
Denmark's -2.59% at a 21.5x forward P/E — the most expensive market in the database after a year of underperformance — is the most analytically uncomfortable data point in the laggard list. Novo Nordisk's competitive headwinds in the GLP-1/obesity drug market have compressed the Danish equity market at a premium multiple. Denmark is paying the price for the same single-stock concentration risk that made it the warning tale of the CNBC analysis comparing Novo Nordisk's weight in the MSCI Denmark to Aramco's weight in Saudi Arabia.
The Central Theme: The Hardware-Software Performance Chasm
The most important structural signal in H1 2026 is not a country — it is the US industry performance dispersion between hardware and software.
Top 5 US Industries
| Rank | Name | ETF | H1 Return |
|---|---|---|---|
| 1 | Semiconductors | VanEck Semiconductor ETF (SMH) | +72.05% |
| 2 | Telecom | SPDR S&P Telecom ETF (XTL) | +46.81% |
| 3 | Digital Infrastructure | iShares U.S. Digital Infrastructure (IDGT) | +37.77% |
| 4 | Oil Services | VanEck Oil Services ETF (OIH) | +27.57% |
| 5 | Oil Refiners | VanEck Oil Refiners ETF (CRAK) | +24.59% |
Bottom 5 US Industries
| Rank | Name | ETF | H1 Return |
|---|---|---|---|
| 1 | Software | iShares Expanded Tech-Software ETF (IGV) | -12.81% |
| 2 | Gold Miners | VanEck Gold Miners ETF (GDX) | -11.73% |
| 3 | Nuclear Energy | VanEck Uranium+Nuclear Energy ETF (NLR) | -8.55% |
| 4 | Healthcare Equipment | SPDR S&P Health Care Equipment (XHE) | -3.87% |
| 5 | Water Resources | Invesco Water Resources ETF (PHO) | -3.62% |
The SMH vs IGV gap — +72.05% versus -12.81% — is 84.9 percentage points in a single half-year. LSEG framed this as "AI stocks shift: hardware outperforms software as chip demand surges." The mechanism is direct: hyperscaler AI capex flows into hardware first — servers, GPUs, HBM memory, data centre power — and into software deployment much later in the adoption cycle. The current period is peak hardware demand intensity.
Individual AI hardware stock returns in H1 2026 underline this: Futunn reported Western Digital at +883% YTD and Micron at +325% YTD by mid-year. ETF.com reported SMH's parent index (SOXX) up 90%, with AI memory-pure-play ETF DRAM among the top performers. These are not sector moves — they are multi-year secular demand shifts landing in a single period.
The Oil Services (OIH) and Oil Refiners (CRAK) industry positions at ranks 4 and 5 reflect the H1 bifurcation: both benefited from the Iran war's energy supply shock through the first five months, then faced the post-Hormuz deal reversal in June. OIH at +27.57% and CRAK at +24.59% net out a profitable half-year that could have been significantly larger had the oil trade not reversed.
Gold Miners (GDX at -11.73%) and Nuclear (NLR at -8.55%) represent the two largest beneficiaries of geopolitical anxiety that failed to persist. GDX typically benefits from risk-off environments — but in H1 2026, risk-on dominated as AI earnings growth provided a positive fundamental backdrop that overwhelmed traditional fear-driven defensive allocations. NLR suffered as the Hormuz deal removed the energy scarcity premium that had briefly made nuclear's long construction timelines seem worth paying for.
The AI Hardware Race: Where It Stands at Halftime
The race for AI hardware capacity — the foundational driver of H1 2026's dominant trade — is not slowing. It is accelerating.
The supply chain map at June 30:
- Logic chips: TSMC holds a structural monopoly on sub-3nm process nodes. No competitor is expected to reach parity before 2028 at the earliest. Q1 2026 revenue of $35.9 billion at 66.2% gross margin. Production allocated through 2027.
- HBM memory: Samsung and SK Hynix dominate with Micron as a distant third. Contracts have moved from 3-6 month to 3-5 year cycles — permanently changing the earnings structure of Korean memory companies from commodity cyclical to AI infrastructure. SK Hynix Q1 2026 revenue: ~$35 billion record. Samsung Device Solutions Q1 2026: ~$54 billion.
- IC substrates: AT&S (Austria, 4.90% of EWO) is Europe's sole entry in the top-5 global IC substrate manufacturers, alongside Ibiden, Unimicron, Nan Ya PCB and Shinko. ABF substrate market projected to grow from $4.89 billion (2024) to $9.55 billion by 2032.
- Semiconductor equipment: ASML (23.71% of EWN) maintains its absolute monopoly on EUV lithography — the only machines capable of manufacturing chips at sub-7nm. The company's backlog extends years. Tokyo Electron and Advantest (both in EWJ's top holdings) serve TSMC's equipment needs for etch, deposition and test.
- Data centre power: Delta Electronics Thailand (20.67% of THD) supplies server power supplies, UPS systems and thermal management to every major hyperscaler. The energy demand per AI GPU cluster has made power electronics a direct AI beneficiary.
The most important H1 2026 revelation about this race: Every country ETF in the global top 10 is connected to a specific layer of this supply chain. This is not coincidence. It is the global equity market correctly pricing a $720 billion annual buildout of AI infrastructure through its only available national-level vehicles.
Valuations: The Map That Matters for H2
The H1 2026 valuation picture — fresh as of June 30, 2026 — reveals a global equity market where the AI premium has migrated from US tech to Asian semiconductors, while traditional value markets remain deeply discounted.
| Market | ETF | Fwd P/E | vs ACWI | H1 Return |
|---|---|---|---|---|
| USA | SPY | 21.7x | +19.0% | +9.54% |
| Taiwan | EWT | 22.7x | +24.5% | +66.24% |
| Denmark | EDEN | 21.5x | +18.0% | -2.59% |
| MSCI ACWI | ACWI | 18.23x | — | +10.45% |
| Japan | EWJ | 15.8x | -13.3% | +15.39% |
| Germany | EWG | 14.6x | -19.9% | -3.00% |
| Thailand | THD | 14.2x | -22.1% | +19.42% |
| UK | EWU | 13.4x | -26.5% | +4.55% |
| Austria | EWO | 10.5x | -42.4% | +17.85% |
| Greece | GREK | 9.5x | -47.9% | +14.88% |
| South Korea | EWY | 8.3x | -54.5% | +92.24% |
| Colombia | COLO | 8.5x | -53.4% | +17.97% |
| Turkey | TUR | 6.7x | -63.2% | +14.03% |
The structurally critical observation: Taiwan at 22.7x forward P/E has more than doubled in six months and is now the most expensive market in the world alongside Denmark — yet its earnings growth (TSMC at 66.2% gross margins) arguably justifies the premium. South Korea at 8.3x has nearly doubled YTD and is still among the cheapest AI-exposed equity markets globally. The earnings expansion has outpaced the price appreciation — the denominator of the P/E ratio is growing as fast as or faster than the numerator.
Denmark at 21.5x P/E with -2.59% YTD is the anomaly that deserves attention entering H2: the most expensive DM market in the database is also among the worst performers. Novo Nordisk's competitive headwinds create a valuation ceiling that the price has not yet reached.
H2 2026 — Three Structural Questions
The first half of 2026 provided the clearest possible signal about what the global equity market is pricing: AI hardware > AI software > oil exporters > energy importers > traditional economy. As H2 opens, three structural questions define the forward outlook.
(1) Can the AI hardware cycle sustain? The bear case: Samsung and SK Hynix Q2 2026 earnings (reporting in July-August) need to confirm that the multi-year HBM cycle is intact. Any earnings guidance cut or order book softening would compress EWY and EWT from elevated levels. The bull case: hyperscaler capex has not been revised lower, AI model parameter scaling continues requiring more compute, and the 3-5 year HBM contracts provide unprecedented earnings visibility.
(2) What does lower oil mean for the global equity map? Brent at $81 and falling removes the Iran war premium from energy exporters (ENOR now -9.16% since Feb 27) and structurally benefits energy importers (EIDO, INDA, THD, EWJ). If the IEA supply glut materialises — Iranian supply restoration, OPEC+ discipline breaking down — oil could fall toward $70. That scenario is explicitly constructive for every oil-importing EM and explicitly destructive for every energy-exporter ETF.
(3) Does the Latin American political re-rating have a second leg? De la Espriella's Colombia government begins in Q3. If the Ecopetrol exploration restart and pension reform reversal materialise as policy — not just campaign promises — COLO at 8.5x P/E has substantial further re-rating potential toward regional peers (Chile 10.5x, Peru 10.2x). The same question applies to Peru (Fujimori vs Sánchez count still live at H1 close), and by extension to the Santander/BBVA LatAm earnings flowing through Spain's EWP.
Key Takeaways
1. The AI hardware buildout is not a cycle — it is a structural shift. $720 billion in 2026 hyperscaler capex is a fact of capital allocation. Every layer of the supply chain from TSMC to SK Hynix to ASML to AT&S to Delta Electronics has a country ETF expression.
2. The hardware-software gap (+72% vs -12.8% for SMH vs IGV) is the defining US industry signal. Software deployment lags hardware buildout by 18-36 months. IGV's -12.8% does not mean software is wrong — it means it is not yet the cycle phase.
3. The Iran war was a 107-day geopolitical shock with a clean resolution. The reversal of the energy trade is structural: ENOR at -9.16% since the war began, IEA warning of supply glut, Brent below $82. The Hormuz deal is confirmed by Polymarket at 100%.
4. Deep-value political re-rating is the secondary H1 theme. Colombia, Peru, Greece and Turkey all ran versions of the same trade: extreme discount to ACWI + identifiable catalyst = re-rating. All four forward P/Es remain below 11x. The re-rating is not complete.
5. The valuation gap between the US (21.7x) and the world's best-performing markets — Korea (8.3x), Colombia (8.5x), Greece (9.5x) — remains historically extreme despite H1's extraordinary returns. The AI earnings expansion has kept the Korean multiple compressed even as the price has doubled.
Track all country ETF performance live at countryetftracker.com. Full H1 valuation comparison at countryetftracker.com/valuation. Detailed country comparisons at countryetftracker.com/compare.
Frequently Asked Questions
What drove the best country ETF returns in H1 2026?
The AI hardware supply chain was the dominant driver. South Korea's EWY (+92.24%) and Taiwan's EWT (+66.24%) top the global leaderboard because Samsung, SK Hynix and TSMC are the irreplaceable manufacturers of the HBM memory and advanced logic chips powering AI data centres. The $720 billion in hyperscaler AI capex committed for 2026 — up 74% from 2025 — flowed directly into demand for these companies' products. The secondary contributors: Netherlands (ASML, Nebius, BESI), Thailand (Delta Electronics), Austria (AT&S), Japan (SoftBank, Tokyo Electron) all represent adjacent layers of the same AI infrastructure supply chain.
Why did Indonesia lose nearly 40% in H1 2026?
Indonesia's -39.55% is almost entirely attributable to the February 27 – June 14 Iran war period. Indonesia imports approximately 85-90% of its oil. The Strait of Hormuz closure drove energy costs to crisis levels, widened Indonesia's current account deficit, collapsed the rupiah (reducing USD-denominated ETF returns independently of equity prices), and triggered capital flight as investors sought higher-quality EM alternatives. The Hormuz deal of June 14 began the reversal, but the magnitude of the damage (-36.56% since Feb 27) means Indonesia needs sustained energy cost relief and currency recovery to significantly recover its H1 losses in H2.
What is the most important US industry signal from H1 2026?
The 84.9 percentage point gap between semiconductors (SMH +72.05%) and software (IGV -12.81%) is the most analytically significant US industry signal. LSEG described it as "hardware outperforms software as chip demand surges." The gap reflects the current phase of the AI buildout cycle: hyperscaler capex is in peak hardware intensity — buying chips, building data centres, installing power systems. Software monetisation lags hardware buildout by 18-36 months. The software companies (Microsoft, Salesforce, ServiceNow, Oracle) that dominate IGV are being sold not because AI is wrong, but because the current capex cycle favours the hardware layer over the application layer.