
Country ETF Insights & Global Market Analysis
Data-driven research, investment strategies and actionable insights on country ETFs and global equity rotation. Stay ahead of cross-country market trends.
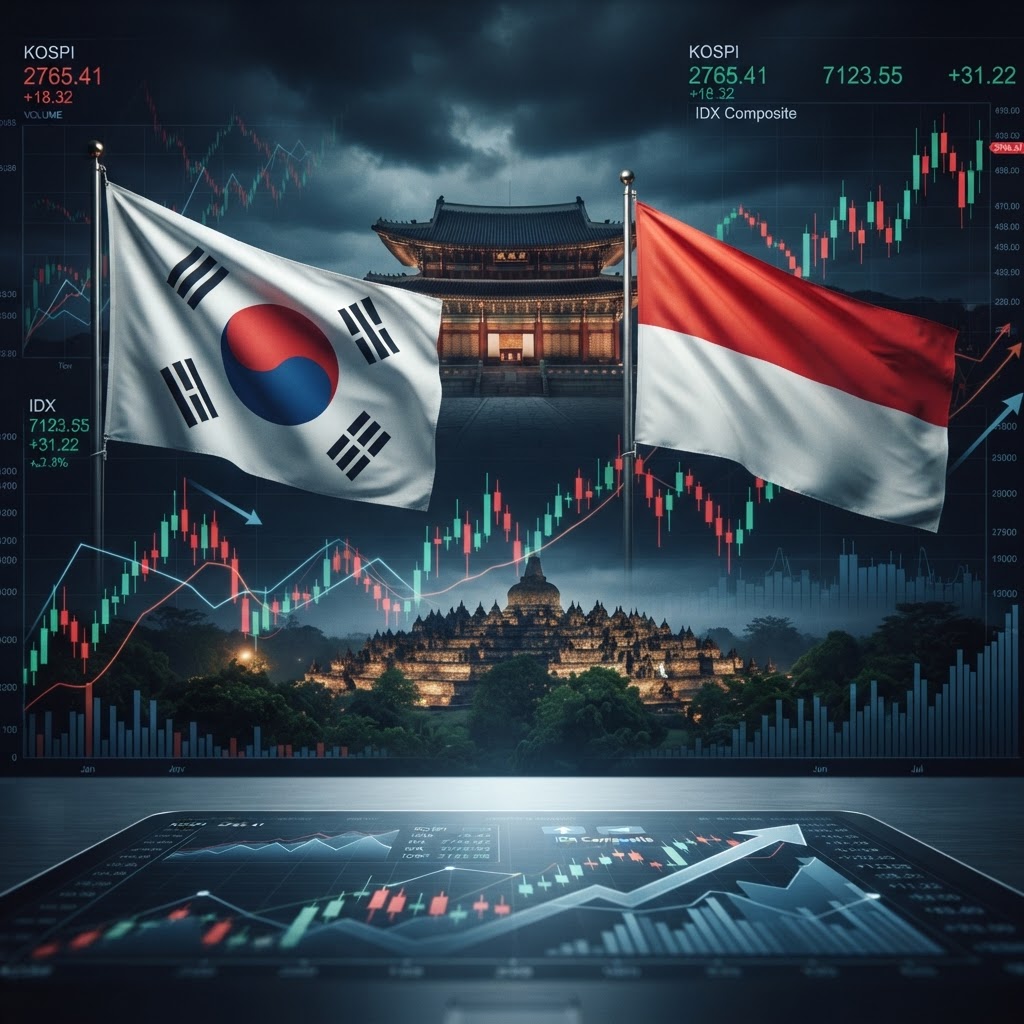
H1 2026 Review: The AI Hardware Race Rewrote the Global Equity Map
H1 2026 ends with South Korea up +92%, Taiwan +66%, and semiconductors (SMH) up +72%. The AI hardware buildout — $720 billion in hyperscaler capex, multi-year HBM contracts, TSMC at 66% gross margins — rewrote the global equity map. An Iran war, a Hormuz shutdown, a peace deal, and two Latin American elections added the geopolitical layer. Full review of every major country and US industry trend.

EPOL ETF Review: Poland's iShares MSCI Poland — Defence, Banking & CD Projekt Powering a +10% YTD Gain
The iShares MSCI Poland ETF (EPOL) is up +9.96% YTD, +26.6% over 1 year, and +101.85% over 3 years — having more than doubled. PKO Bank (15.4%), PKN Orlen (12.5%), Allegro (6%), CD Projekt (2.65%). Poland is Europe's most dynamic EM: NATO defence spending, banking recovery, and a tech cluster that includes the studio behind The Witcher. Full review.

EWP ETF Review: Spain's iShares MSCI Spain — +112% in 3 Years, Europe's Banking Recovery Star
The iShares MSCI Spain ETF (EWP) has returned +9.43% YTD, +36.9% over 1 year, and +112.21% over 3 years — one of the best 3-year performances in the European developed market universe. Santander (19.4%), Iberdrola (14.0%) and BBVA (12.9%) dominate a 27-stock fund with $1.87B in AUM. Full review.

EWU ETF Review: UK's iShares MSCI United Kingdom — HSBC, AstraZeneca & the Case for Britain's Undervalued Market
The iShares MSCI United Kingdom ETF (EWU) provides exposure to the UK's FTSE large-cap universe — HSBC, AstraZeneca, Shell, Rolls-Royce, Unilever. Up +4.71% YTD, +43.9% over 3 years. The UK is Europe's most liquid equity market and consistently one of the highest-yielding. Full review with all data.

De la Espriella Wins Colombia — COLO's Second Milei Leg Has Just Begun
Abelardo de la Espriella won Colombia's presidential runoff on June 20-21, 2026. The Milei trade — first signalled by COLO's +8.8% surge on June 1 first-round day — is now confirmed. COLO is up +18% YTD. The second leg: energy exploration restart, pension reform reversal, FDI recovery. Full analysis of where COLO goes from here.
Best Country ETFs in June 2026: Korea, Austria & Netherlands Lead — While China and Indonesia Drag
South Korea's EWY has more than doubled YTD at +109%. Taiwan's EWT is up +65.7%. Austria (EWO) and Netherlands (EWN) are both up nearly +20%. Colombia (COLO) +18% on the De la Espriella election win. The full June 2026 country ETF performance table — winners, losers, and the macro regime shift from oil war to post-Hormuz glut.

Oil Enters a Supply Glut — Brent Down 25% From Peak as Hormuz Reopening Overshoots
Brent crude is down more than 25% from its April peak as the Hormuz reopening deal has produced a supply surge the market wasn't fully prepared for. The IEA warned of a global oil glut. Trump said the deal is "not final." Geneva talks were abruptly postponed. Norway's ENOR ETF has reversed all its war-era gains and now sits -7.8% since February 27.
The Hormuz Reopening Trade: Oil Importers Surge — But Which ETF Laggards Will Actually Outperform?
Trump announced a deal with Iran on June 14, reopening the Strait of Hormuz and sending oil below $80 for the first time since mid-April. On June 15, a rotation no analyst had seen since February 27 emerged: Indonesia, India, Greece and Turkey led country ETF gains. Norway crashed -6.3%. The question now: which of the Iran war laggards — down 5% to 29% since February — will actually recover, and which were already broken before Hormuz closed?

GREK ETF Review: Greece Has Returned +151% in 5 Years — Double the S&P 500. Here's Why.
The Global X MSCI Greece ETF (GREK) has returned +151% over five years — more than double the S&P 500. +14.44% YTD, +109.76% over 3 years. At 9.82x forward P/E and a 46% discount to the ACWI, Greece is the most undervalued European market with a positive multi-year growth trajectory. This week Greece got approval for early repayment of €6.95 billion in bailout loans. The re-rating continues.

Is China Losing the AI Race? GXC Is Down -6% While Taiwan Soars +61%
The SPDR S&P China ETF (GXC) is down -6.1% year-to-date while Taiwan's EWT is up +61% and Korea's EWY has more than doubled. The 67-percentage-point gap between China and Taiwan encapsulates a structural reality: China is not in the AI semiconductor supply chain that is driving global equity returns in 2026. Full analysis of why, and whether GXC's 10.87x P/E represents value or a value trap.

Peru's EPU ETF Surges on Election Day — Is Fujimori's Win the Start of a New Milei Trade?
Peru's iShares MSCI All Peru Capped ETF (EPU) surged approximately +5.5% on June 7 as Keiko Fujimori (conservative, pro-US) faced leftist Roberto Sánchez in a presidential runoff. The race is too close to call. EPU is up +18.51% YTD — the 10th best country ETF globally. Peru has elected 10 presidents in a decade. Here's why the market is pricing for change.
Colombia's COLO ETF Is Up 16% This Month — Is De la Espriella the Next Milei?
The Global X MSCI Colombia ETF (COLO) is up +20.34% YTD and has gained approximately +16% in the last month as right-wing outsider Abelardo de la Espriella leads pre-runoff polls ahead of June 21. At 8.74x forward P/E and a 6.6% dividend yield, Colombia is pricing four years of Petro political risk. Markets are asking: is this the next Milei trade?

Global Markets Call: Two Latin American Political Trades, A Stalling China, and Greece's Quiet Boom
Global Markets Call — June 12, 2026. This week's five themes: Colombia and Peru are running the Milei playbook simultaneously. China continues to miss the AI semiconductor rally while Taiwan soars +61%. Greece is quietly doubling the S&P 500 on a 5-year basis. And Iran peace deal odds have surged to 74.5% for December — the most important macro signal of the week.

The AI Trade Is Cooling, Oil Is Re-Escalating, and the Dollar Is Back in the Spotlight
Global Markets Call — June 8, 2026. The AI semiconductor trade that defined Q1-Q2 is cooling: EWY has pulled back from +106% to +80% YTD, EWT from +68% to +54%. Oil surged +4% this morning on renewed Iran-Israel escalation. Trump is warning the Fed against rate hikes. Five themes driving country ETF rotation this week.

Austria's EWO ETF Just Found Its AI Champion — And Nobody Is Talking About It
Austria's EWO ETF is up +15.85% YTD — the 9th best country market globally, 4th best in Europe. AT&S Austria Technologie (ATS), up +373% year-to-date, is responsible for nearly a third of EWO's entire return despite carrying less than 5% fund weight. AT&S makes the IC substrates that sit between TSMC's chip dies and the finished GPU packages powering the world's AI data centres. Europe's most obscure AI supply chain stock just became impossible to ignore.

THD vs INDA: Thailand ETF vs India ETF — Asia's Most Extreme Divergence in 2026
Thailand's THD ETF is up +25.1% YTD. India's INDA ETF is down -11.1%. Both are Asian emerging markets. The 36-percentage-point divergence is the most extreme intra-regional gap in the emerging markets universe in 2026. Delta Electronics' AI data centre demand vs $53B in FII outflows and earnings disappointment. Full comparison with all data.

EWN vs EWG: Netherlands AI Cluster vs Germany Legacy — Why Two European Neighbors Are Worlds Apart in 2026
The iShares MSCI Netherlands ETF (EWN) is up +19.6% YTD. The iShares MSCI Germany ETF (EWG) is up just +2.5%. Same currency. Same continent. Same European Central Bank. A 17-percentage-point gap in 2026 performance. The difference is simple: ASML, Nebius, ASM and BESI vs Volkswagen, BASF and legacy auto. Full comparison of Europe's biggest intra-regional divergence.

THD ETF Review: Thailand Is the World's 4th Best Country ETF in 2026 — What's Driving the Rally?
The iShares MSCI Thailand ETF (THD) has gained +25.1% year-to-date, making Thailand the 4th best-performing country market globally in 2026. Delta Electronics Thailand — at 20.7% of the fund — is the key driver, surging on AI power supply and data centre electronics demand. Full review with data on performance, holdings, valuation and seasonality.

EWJ ETF Review: Japan's Nikkei Hits All-Time Highs — Performance, Holdings & Outlook 2026
The iShares MSCI Japan ETF (EWJ) is up +15.9% year-to-date, tracking a Nikkei 225 that has climbed above 66,000 — all-time territory. Japan's equity market is powered by AI infrastructure investment, corporate governance reforms, and a Bank of Japan navigating its first real rate cycle in decades. Full review with data.

Colombia's COLO ETF Surges +8.8% — Its Best Day Since March 2020. Is This the Next Milei Trade?
The Global X MSCI Colombia ETF (COLO) surged +8.8% on June 1 — its best single-day performance since the March 2020 pandemic rebound — after far-right outsider Abelardo de la Espriella won Colombia's presidential first round. Markets are pricing a potential end to four years of Petro's left-wing government. The runoff against leftist Iván Cepeda is June 21. Is Colombia the next Milei trade?
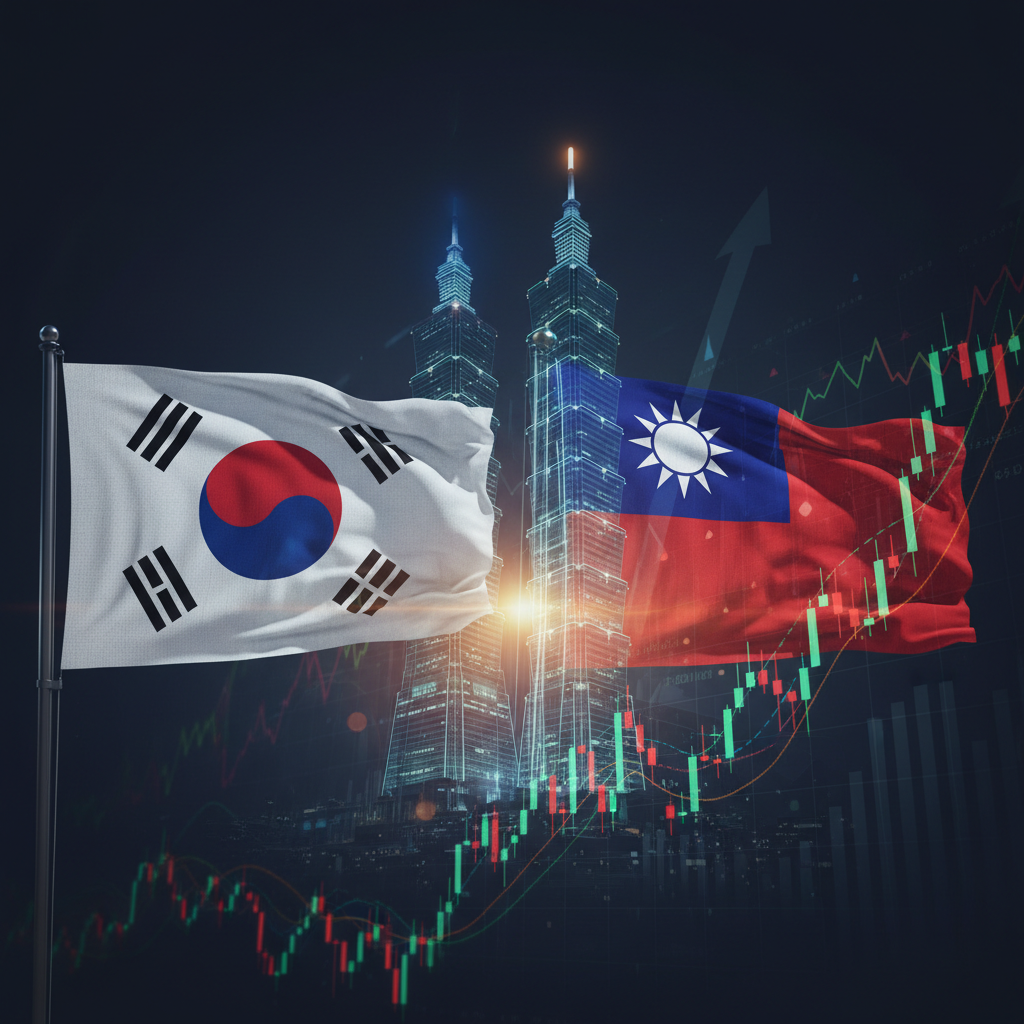
South Korea and Taiwan Are Rewriting the Global Stock Market Map — And Three Companies Are Behind All of It
South Korea's EWY ETF has more than doubled YTD at +106%. Taiwan's EWT is up +61%. Taiwan just overtook India to become the world's 5th largest stock market. South Korea's KOSPI crossed 7,000. Samsung hit $1 trillion in market cap. Three companies — TSMC, Samsung and SK Hynix — are redrawing the global equity hierarchy in real time.

Nokia Is Back — And It's Dragging Finland's EFNL ETF To All-Time Highs
The iShares MSCI Finland ETF (EFNL) has hit all-time highs, up +18.7% YTD — the 6th best country market in the world. Nokia Oyj is up +140% year-to-date, trading at a 16-year high. Nvidia has taken a $1B stake. One stock explains 79% of EFNL's entire return. A deep dive into Finland's unexpected AI-driven breakout.

Europe’s Hidden AI Winner? Why The Netherlands Is Starting To Look Like South Korea
The iShares MSCI Netherlands ETF (EWN) has gained +17.2% YTD, +14.1% since April 1, and +6.4% since the Iran war began — making it the 6th best-performing country ETF globally and 2nd best in Europe. Four AI semiconductor stocks explain 92% of the entire return. The parallel with South Korea's EWY is striking — and analytically exact.

India's INDA ETF Is Having Its Worst Year Since Inception — What Broke the Decade-Long Bull Run?
The iShares MSCI India ETF (INDA) is down -11.2% YTD — its worst year since the fund launched in 2012. The Nifty 50 is on pace for its worst annual performance since 2011, ending a streak of positive closes that ran unbroken from 2016 through 2025. $53 billion in foreign outflows, an oil shock, and a valuation de-rating are converging on what was once the most crowded EM trade in the world.

Indonesia's EIDO ETF Crashes To March 2020 Lows — The Worst Market In The World This Year
The iShares MSCI Indonesia ETF (EIDO) has collapsed -27.9% year-to-date, trading at $13.49 — levels last seen during the peak of the March 2020 global lockdown panic. The rupiah has hit a record low of Rp 17,500 per dollar. Indonesia is the worst-performing country ETF in the world in 2026. Here's what's happening.
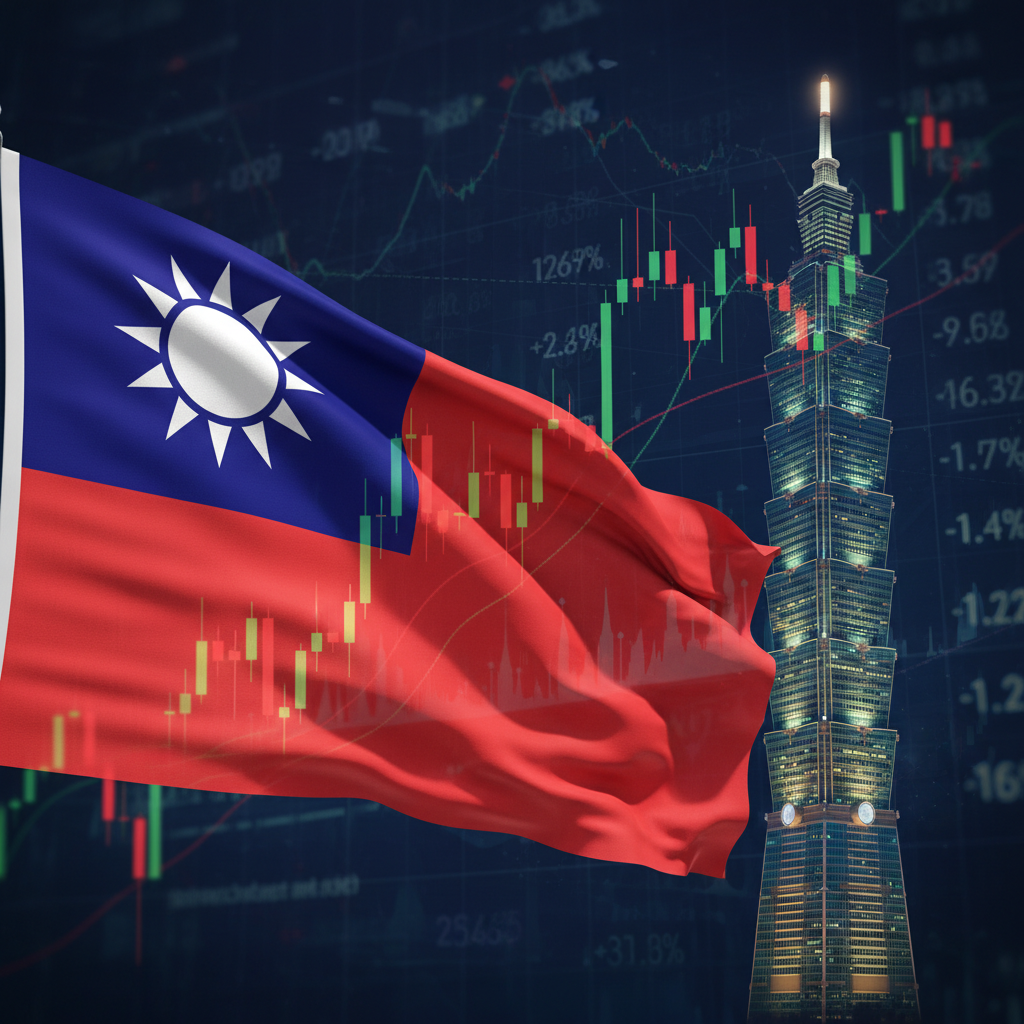
EWT ETF Review: Is Taiwan's AI Dominance Worth Paying a Premium For?
The iShares MSCI Taiwan ETF (EWT) is up +49.3% YTD and +78% over one year, trading near all-time highs above $94. The entire thesis rests on one company — TSMC — and one structural reality: Taiwan owns the AI chip supply chain. Full review of performance, holdings, valuation, seasonality and key risks.
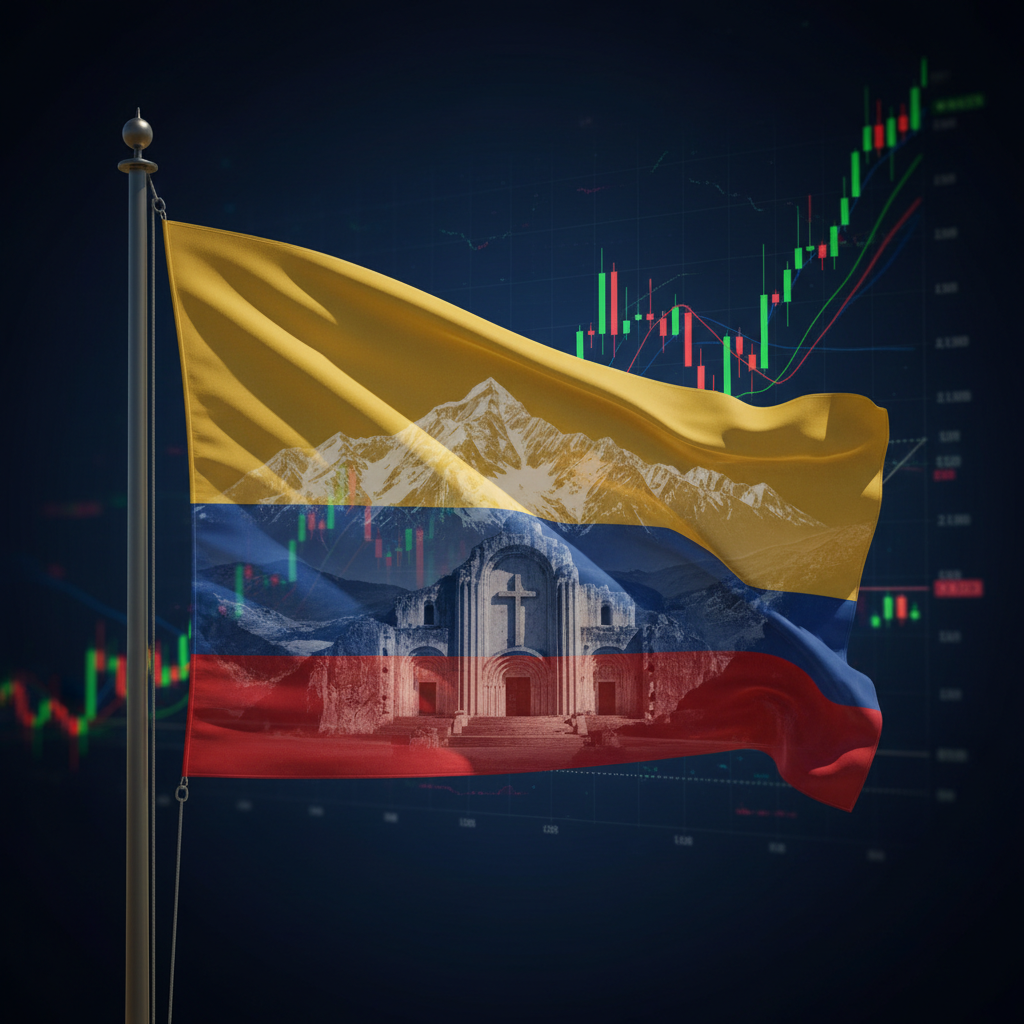
A Political Shock Is Hitting Colombia’s COLO ETF — Here’s Why Investors Are Worried
While South Korea surged 55% and Taiwan hit all-time highs, the iShares MSCI Colombia ETF (COLO) quietly became the worst-performing country ETF in the world over the past month. It missed the energy exporter rally in March. It missed the ceasefire rally in April. The reasons are structural — and they start with Ecopetrol.

Why The Brazil ETF EWZ Is Falling: Petrobras Gasoline Price Hike Sparks Subsidy Shock
On May 13, the iShares MSCI Brazil ETF (EWZ) fell 3.8% in a single session. The driver: Lula's government announced direct fuel subsidies of up to R$2.9B per month, one day after Petrobras signalled an imminent gasoline price increase. Petrobras — 14.6% of EWZ — fell sharply. This is the third time in three Lula administrations that pricing policy has been weaponised before an election.
EWY ETF: Why the Memory Supercycle Is Sending South Korea to Its Best Week Since 2008
EWY is on pace for its best week since December 2008: +16.6% in 5 sessions, +230% over one year. The driver is not a country story — it is a memory story. SK Hynix at 5.1x NTM P/E and Samsung at 5.3x are the cheapest large-caps in the Nasdaq era. But SK Hynix now trades 157% above its 200-day moving average. SanDisk is 295% above its 200-day. History has a view on what happens next.

Global Stock Market Valuations: The Cheapest and Most Expensive Country ETFs Right Now
MSCI forward P/E data as of April 30, 2026: Turkey and South Korea trade below 7.6x — a 58%+ discount to the global benchmark. New Zealand trades at 37x. The USA at 21.5x is the most expensive major market in the world. The gap between the cheapest and most expensive markets has never been wider. Full rankings, explanations and macro context across 40+ countries.

The Ceasefire Trade, 37 Days Later: The 10 Country ETFs That Rallied the Most Since March 30
On March 30, 2026, Trump announced a 2-week Iran ceasefire. In the 37 days that followed, 10 country ETFs gained between 16% and 56%. South Korea (EWY) leads with +55.6%. Taiwan (EWT) is second at +37.1%. The top 10 spans three distinct trade clusters — AI semiconductors, geopolitical de-escalation, and deep-value European re-rating — and understanding which cluster each ETF belongs to determines what happens next.

EWY ETF: South Korea Is the Best-Performing Country ETF Across Every Major Time Horizon
The iShares MSCI South Korea ETF (EWY) is now the best-performing country ETF across every major time horizon — 1-month (+43.6%), YTD (+86%), 6-month (+93%), 1-year (+209%) and 3-year (+194%). Samsung hit $1 trillion market cap. KOSPI broke 7,000 for the first time in history. SK Hynix Q1 profit surged 5x. This is what the numbers mean and what comes next.
Country ETF Monthly Review April 2026: Tech Wins, Commodities Lose — What May Brings
April 2026 produced the sharpest inversion of March's commodity trade in country ETF history. EWY +28%, EWT +25.5%, EFNL +11.7%. The biggest losers were commodity exporters: EIDO -5%, EPU -4.8%, ARGT -3.7%. Six country ETFs posted double-digit gains. Now the question is what May brings — and the seasonal data for the biggest April winners is not encouraging.

EWT ETF: Taiwan's Biggest Monthly Rally Since 2009 — Inside the TSMC-Driven Surge
The iShares MSCI Taiwan ETF (EWT) is on pace for its biggest monthly return since April 2009 — up approximately 28% month-to-date in April 2026. TSMC alone accounts for 21.25% of the fund. The rally is the convergence of three forces: Iran war resolution removing the oil headwind, TSMC's Q1 2026 AI earnings acceleration, and a global risk-on repositioning into the world's most irreplaceable semiconductor complex.

KSA ETF Review: Saudi Arabia in 2026 — Vision 2030, Oil, Performance & Outlook
The iShares MSCI Saudi Arabia ETF (KSA) is the best-performing country ETF since the Iran war started (+7.16% from Feb 27). With 128 holdings, $747M AUM, a 14.67x forward P/E and the strongest seasonal signal in the entire dataset (March and April both 82% win rate), KSA is the most direct expression of OPEC+ oil price dynamics and Saudi Vision 2030 in ETF form.

EWZ ETF Review: Brazil in 2026 — Performance, Holdings, Valuation & Outlook
The iShares MSCI Brazil ETF (EWZ) is up +6.6% since the Iran war started on February 27, making it one of the few country ETFs that gained during the oil shock period. At 9.82x forward P/E with a 3.75% dividend yield and $11.75B in AUM, EWZ offers the broadest commodity exposure of any single-country EM ETF — iron ore, oil, agriculture and financials in a single fund.
EWY ETF Review: South Korea at All-Time Highs — Performance, Holdings & Outlook 2026
The iShares MSCI South Korea ETF (EWY) hit all-time highs on April 17, 2026 — fully recovering from the Iran war shock that sent it down 18.7% in a single month. With $19.6B in AUM, a 7.08x forward P/E (58.6% discount to ACWI), and Samsung + SK Hynix driving AI semiconductor demand, EWY is the most analytically complex country ETF in the world right now.
Hormuz Is Open: South Korea Hits Record Highs, Oil Crashes 13%, 10 Country ETFs at All-Time Highs
At 9:27 AM ET on April 17, Trump posted: "THE STRAIT OF HORMUZ IS COMPLETELY OPEN AND READY FOR BUSINESS." Oil fell 13%. The Dow surged 1,000 points. South Korea (EWY) hit all-time highs. Ten country ETFs are trading at record levels today. This is the full market update.
The Ceasefire Trade: Every Major Country ETF Rallied. Now What?
Since March 30 — the day before Trump announced a 2-week Iran ceasefire — 22 country ETFs delivered double-digit returns. EWY +26.6%. GREK +18.0%. EWT +17.9%. SPY breached 7,000 for the first time. This is the full ceasefire trade scorecard, what drove it, and what Polymarket says happens next.
S&P 500 Hits Record High in One of the Fastest Rallies in History — Country ETF Performance Since February 27
SPY is at all-time highs after a 15%+ rally in 11 sessions — only 15 precedents in ETF history. But the real story is the country ETF table from February 27: Saudi Arabia leads at +9.3%, South Korea is -4.3% despite its massive YTD gain, and the energy exporter/importer narrative has collapsed. Full IranWar period data with live Polymarket odds.

Emerging Markets ETF: EEM vs IEMG vs VWO — Full Comparison 2026
EEM, IEMG and VWO are the three dominant emerging markets ETFs with a combined AUM exceeding $200 billion. They track similar indexes but differ significantly in cost, holdings breadth, and benchmark construction. The right choice depends on cost sensitivity, small-cap exposure, and index methodology preference.

Which Country ETFs Have the Lowest Correlation to the S&P 500?
Turkey (TUR) has the lowest 5-year correlation to SPY at 0.25. Kuwait (KWT) is the most stable across all timeframes, never exceeding 0.37. China (GXC) looks like a diversifier at 0.38 over 5 years — but its 3-month correlation is 0.68. Full ranking of all 43 country ETFs across five timeframes.

How to Invest in European ETFs from the US: A Complete Guide (2026)
European ETFs are among the most accessible international investments available to US investors — but the choice between broad regional funds and individual country ETFs involves tradeoffs in cost, tax treatment, currency exposure and concentration risk that are worth understanding before allocating capital.
China ETF Comparison 2026: GXC vs MCHI vs FXI – Which Is Best?
Three US-listed ETFs dominate China equity exposure: GXC (SPDR), MCHI (iShares) and FXI (iShares). They differ significantly in index methodology, holdings breadth, concentration and regulatory structure risk. China trades at 11.03x forward P/E — a 35.6% discount to the MSCI ACWI — but the choice of vehicle matters.
What Is a Country ETF? A Beginner's Guide to International Investing
A country ETF is a US-listed fund that tracks the equity market of a single foreign country. It trades on US exchanges in US dollars, requires no foreign brokerage account, and provides instant diversification across dozens of companies in that country's stock market.

Best Country ETFs to Buy in April 2026: What the Seasonality Data Actually Shows
April seasonality data from CountryETFTracker shows GREK averaging +4.88% in April with a 78.6% win rate — the strongest combination in the country ETF universe. KSA averages +4.14% with an 80% win rate. EWZ +3.36% and EWY +3.21% both at 70%. With the Iran ceasefire announced April 7, macro and seasonality are now aligned for the first time since the war began.
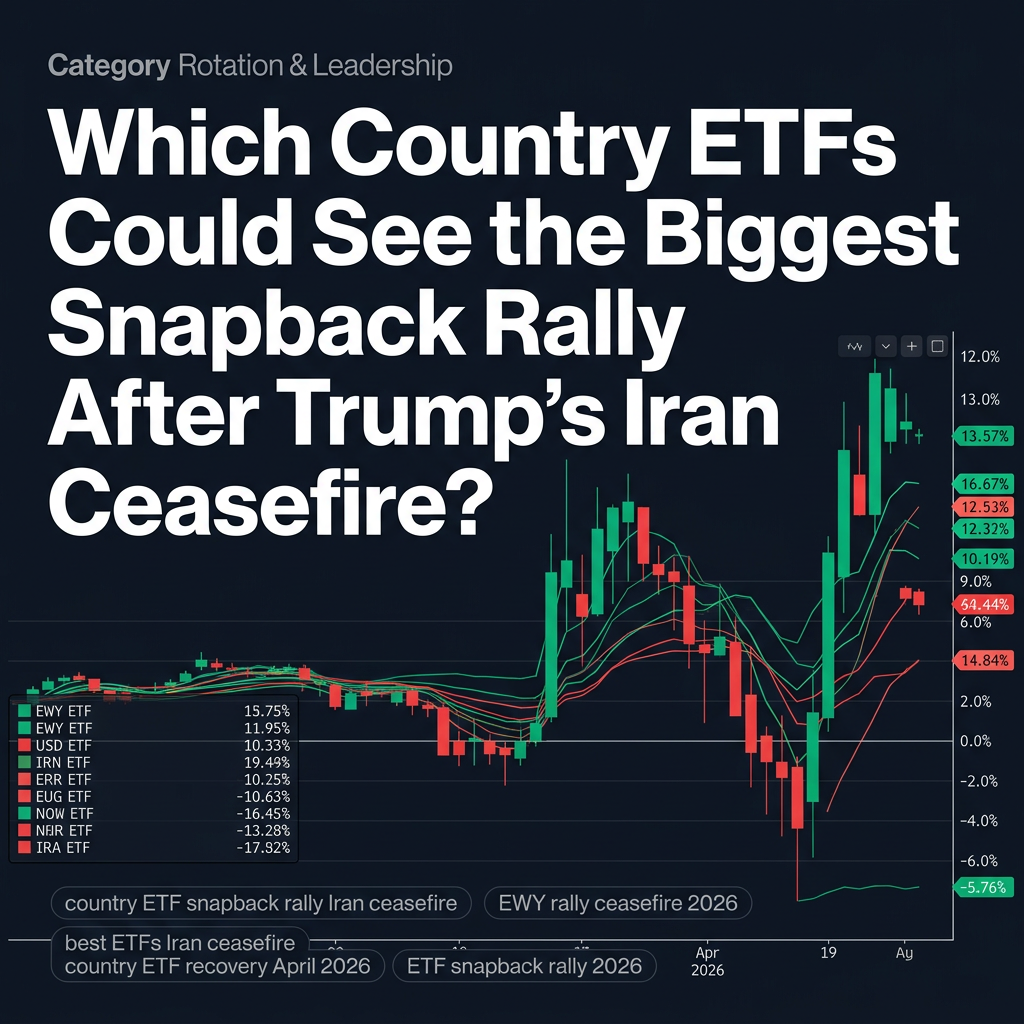
Which Country ETFs Could See the Biggest Snapback Rally After Trump's Iran Ceasefire?
Trump's two-week Iran ceasefire has triggered the rotation trade — but day one only scratches the surface. EWY fell -18.74% during the war and recovered just +7.89% today. EZA fell -16.91% and recovered +6.49%. The full snapback, if Hormuz normalises permanently, is multiples larger. Here is the quantitative framework for ranking the candidates.
Ceasefire Trade: Country ETFs Snap Into Reverse as Trump's Iran Deal Triggers Historic Rotation
Trump's two-week ceasefire with Iran announced April 7 — 90 minutes before his own deadline — triggered the sharpest single-session country ETF rotation since the war began on February 27. Everything that lost during the war is recovering. Everything that won is stalling. The mirror image is exact.
Country ETF March 2026 Recap: The Month the Iran War Repriced Every Equity Market on Earth
March 2026 was the month the Iran war fully repriced the global equity map. EWY posted its worst monthly return since October 2008. EZA recorded its worst since March 2020. ENOR closed its fourth consecutive positive month. The S&P 500 had its worst quarter since 2022. One variable — energy trade balance — explained it all.
SPY ETF Analysis: Is This the Beginning of a Bear Market?
The SPDR S&P 500 ETF Trust closed Friday March 27 at $634.07 — 9.2% below its January 2026 all-time high, 4% below its 200-day moving average, and recording its first weekly close below the 50-week moving average. Five consecutive losing weeks. The worst month since September 2022. The transmission mechanism is clear: Iran war → oil shock → inflation → rate hike risk → multiple compression.

Only Two Country ETFs Are Positive Since the Iran War Began — KSA and ENOR
Since the Iran war began on February 27, only two country ETFs out of the entire US-listed universe are positive: KSA at +2.80% and ENOR at +1.54%. South Africa is down -20.88%, South Korea -19.59%, UAE -14.73%. The correlation between energy trade balance and ETF returns now stands at 0.585 — one of the strongest single-factor signals in recent market history.
Country ETF Weekly Wrap: Week of March 27, 2026 — Iran Wind-Down Hopes Spark EM Bounce
Brazil surged +5.08%, UAE bounced +4.35% and Mexico gained +4.04% in the week ending March 27 as Trump's 'winding down' language sparked a partial unwinding of the Iran war trade. Israel fell -4.93% on direct escalation. Here is the full weekly scoreboard across 43 country ETFs.
Global Rotation Update: The Iran War Trade Is Cracking — What Comes Next?
The Iran war rotation trade is showing its first cracks. Trump says operations may be 'winding down' while Iran has rejected his ceasefire terms. ENOR fell -0.62% this week while EWZ surged +5.08% and UAE gained +4.35%. The rotation leadership is shifting — here is the data behind the shift.

EWY vs EWT: South Korea ETF vs Taiwan ETF — Two Chip Giants, One War, Diverging Paths
The iShares MSCI South Korea ETF and the iShares MSCI Taiwan ETF both sit at the centre of the global AI supply chain — but they have diverged sharply in 2026. EWY is down -3.54% this week while EWT is flat. The difference is not the war; it is portfolio structure, energy exposure and valuation premium.
EWZ ETF Review: Brazil Is 2026's Stealth Commodity Winner as the World Burns
The iShares MSCI Brazil ETF is up +15.96% year-to-date and gained +5.08% in a single week as ceasefire optimism lifted commodity prices. With Petrobras and Vale combining for nearly 25% of the portfolio, EWZ is the most direct emerging market expression of the current commodity supercycle — at a 44% valuation discount to global peers.

EZA ETF Review: South Africa Is the Worst Performing Country ETF Since the Iran War Began
The iShares MSCI South Africa ETF has lost -22.68% since the Iran war began on February 27 — the worst performance of any country ETF in the universe over that period. A triple shock of energy import costs, a historic precious metals collapse and rand depreciation has hit EZA's mining-heavy portfolio from every direction simultaneously.

Gulf ETFs in Freefall: Qatar and Kuwait Face -14% GDP Shock as Iran War Bites
Goldman Sachs projects Qatar and Kuwait could each see GDP contract by 14% in 2026 if the Iran war persists through April — the worst economic slump since the Gulf War of the early 1990s. The four Gulf country ETFs tell a story of conflict-zone energy exporters facing an unprecedented paradox: high oil prices, zero production.

European ETFs Face a 2022 Nightmare Replay: Energy Shock Meets Rate Hike Risk
Markets are pricing three Bank of England rate hikes, two ECB hikes and a 50% probability of a Fed hike by October 2026. With oil above $104 and European energy costs spiking, the combination of inflation shock and tighter monetary policy is reviving the worst memories of 2022 for European country ETF investors.

Which Country ETFs Are Best Positioned for the Global AI Race?
Bank of America economists project AI capex will add 0.4pp to US GDP in 2026, with Taiwan, South Korea and Mexico identified as the biggest supply-chain beneficiaries. This analysis maps the BofA AI thesis to the country ETFs that stand to capture it — and the Iran war complication that investors must price.

How to Build a Country ETF Portfolio: A Step-by-Step Framework
Building a country ETF portfolio requires more than picking the top performer. This step-by-step framework covers macro regime identification, valuation screening, correlation limits, position sizing and exit discipline — illustrated with live 2026 data from the Iran war rotation.
EWG ETF Review: Germany Is Europe's Most Energy-Exposed Large Economy
The iShares MSCI Germany ETF is down -6.45% YTD and approximately -9% since the Iran war began. Germany's structural energy import dependence — the legacy of decades of Russian gas reliance — makes it the most exposed large European economy to the current oil shock. The portfolio tells the story.

Best Country ETFs for 2026: Full Rankings by Performance, Valuation and Momentum
The Iran war has redrawn the global equity map. Norway leads all country ETFs at +24.3% YTD while Indonesia has collapsed -17.7%. This is the full ranking of every major country ETF by performance, valuation and momentum as of March 19, 2026.
How to Invest in Country ETFs – A Complete Guide (2026)
Country ETFs are the most direct way to express a macro view on any economy in the world — and 2026 has already shown why that matters. From Norway's +24% YTD gain to Indonesia's -18% collapse, the Iran war has produced one of the widest cross-country performance dispersions in recent history.

ENOR ETF Review: Norway Is the Best Performing Country ETF Since the Iran War Began
Since US and Israeli forces struck Iran on February 27, the iShares MSCI Norway ETF has outperformed every other country ETF in the universe. Fossil fuels represent 60–65% of Norway's total goods exports. Prediction markets tell a nuanced story about how long this trade has left to run.
Iran War Week 3: UAE and Qatar Break the Exporter Rule as Global Markets Price a Long Conflict
The exporter/importer divide that has defined global equity markets since February 27 just produced its most important anomaly. UAE and Qatar — both energy exporters — are among the worst performers of the past week. Here's why, and what it means for country ETF positioning.

INDA vs VNM: India ETF vs Vietnam ETF Compared (2026)
VNM has outperformed INDA by nearly 40% over the last year, though INDA maintains a stronger five-year growth record. This analysis compares the AUM, expense ratios, and macro drivers for the iShares MSCI India ETF and VanEck Vietnam ETF.

The Great Divide: How the Hormuz Crisis Is Splitting Global Markets Between Energy Exporters and Importers
Day 13 of the Iran war and the market divide is no longer subtle. South Korea's EWY has lost 16.7% since the crisis began. Norway and Saudi Arabia are flat. Goldman Sachs is pricing $98–$110 Brent. The full country ETF performance breakdown — and what's driving it.
South Korea ETF (EWY) vs Brazil ETF (EWZ): Which Could Better Withstand An Oil Shock?
South Korea's EWY still leads global markets YTD with a 36.6% gain, but the Iran war is rewriting the 2026 leaderboard in real time. Brazil's EWZ — ranked third globally — is structurally better equipped for a prolonged oil shock. Here's why.
How To Position A Country ETF Portfolio During An Oil Shock
The war in Iran has created a market regime where energy trade balance as % of GDP is the dominant driver of country ETF performance. A framework for understanding the divide — and why it sharpens the longer the crisis runs.
Country ETF Market Update — Iran War Escalates, IEA Releases Emergency Reserves, Energy Exporters Hold As Global Markets Retreat
Day 13 of the Iran war delivers fresh shocks — tanker attacks, $100 Brent and a record IEA reserve release. Energy exporters gain while global markets retreat. Full weekly country ETF breakdown.
Iran War Market Impact: Best And Worst US Sector ETFs And Country ETFs
Ten days into the Iran war, global markets split along energy lines. Technology and energy ETFs lead while energy importers like South Korea plunge 12.94%.

Iran War Market Monitor: Track Which Country ETFs Win or Lose From Oil Shocks in 2026
CountryETFTracker's Iran War Market Monitor shows which country ETFs win or lose from oil shocks. Interactive tool tracks energy exposure and ETF performance since Feb 27, 2026.
South Korea's Historic Selloff Amid Iran War — A Rare Buying Opportunity?
South Korea ETF (EWY) suffers historic 17% weekly decline as Iran war disrupts energy markets. Despite the crash, valuation at 10x P/E creates compelling opportunity.
Iran War Global Market Analysis: Winners and Losers Among Country ETFs
The Iran war has triggered the largest country ETF reshuffling, with energy importers like South Korea plunging 11% while exporters like Norway gain ground. Enhanced correlation analysis reveals the data-driven patterns.
Norway ETF (ENOR): How Iran War Tensions Drive the Third-Best Country ETF Performance in 2026
The iShares MSCI Norway ETF (ENOR) has surged +20.57% year-to-date as escalating Iran conflict drives oil prices to 12-month highs. With Brent crude topping $83, Norway's energy-heavy stock market is benefiting from the oil price rally.
Best Country ETFs for March – Seasonality Analysis
Historical March seasonality shows UAE ETF averaging 3.5% returns with strong win rates. Discover which country ETFs benefit from March seasonal patterns in 2026.
March 3, 2026: Historic Country ETF Selloff as Iran War Enters Day Four
EWY crashes 10.2% to worst day since March 2020 as Iran war enters fourth day. All 43 country ETFs bleed red while oil hits $82.52. Only Gulf exporters limit losses.
EWZ ETF Analysis: Brazil's 14.9% YTD Rally Outperforms Global Markets Despite Underperforming Longer-Term
Brazil's EWZ ETF leads 2026 with 14.9% YTD gains while global markets struggle, but longer-term data reveals underperformance vs developed markets. Tactical rotation opportunity or value trap?