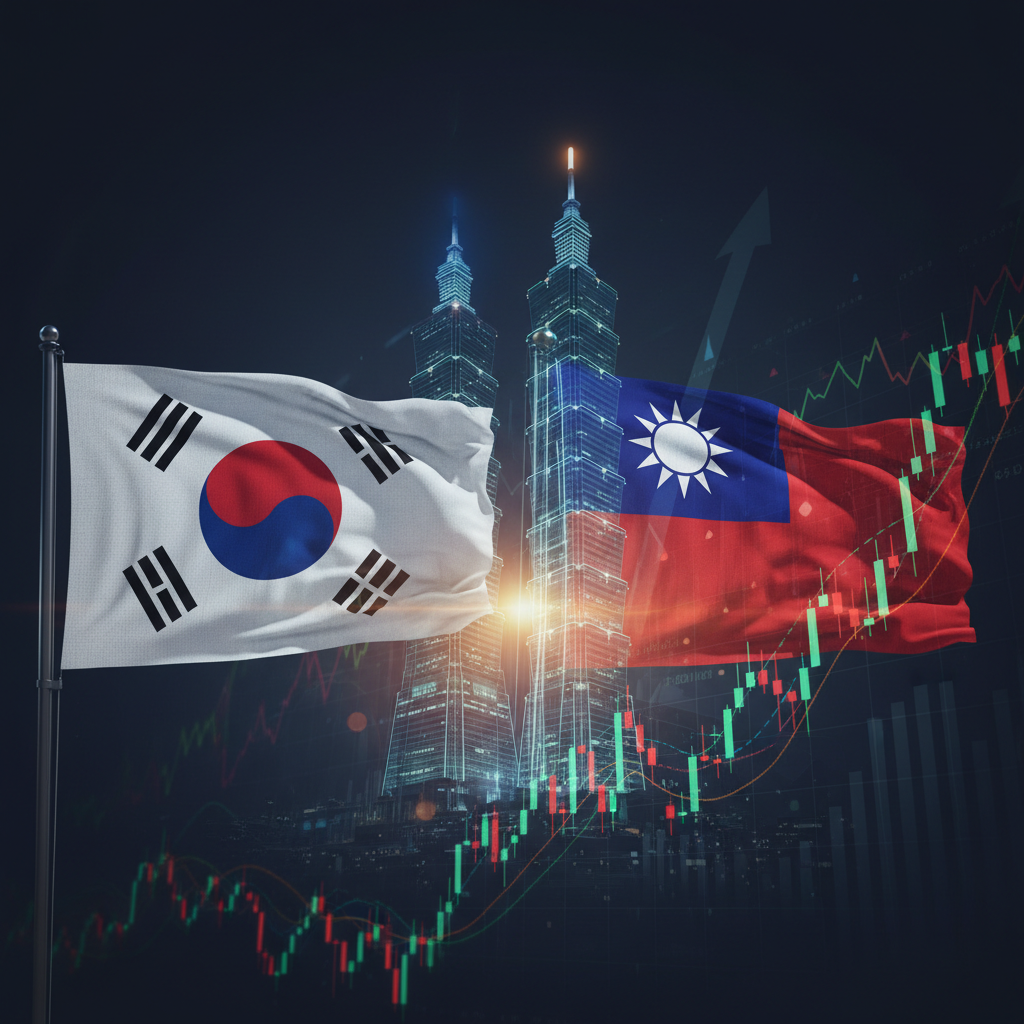
In December 2025, Taiwan ranked 9th in global equity market size. South Korea ranked 11th. Both were familiar entries on a leaderboard that had not changed meaningfully in years — comfortably below the UK (6th) and Canada (7th), solidly in the second tier of global markets.
By May 27, 2026, Taiwan has surpassed India to become the world's 5th largest stock market, with a total equity market capitalisation of approximately $4.95 trillion. South Korea has climbed to 8th place, ahead of the United Kingdom. The iShares MSCI South Korea ETF (EWY) has gained +106.39% year-to-date — more than doubling. The iShares MSCI Taiwan ETF (EWT) is up +60.77% over the same period. South Korea's KOSPI index has crossed 7,000 for the first time in its history. Samsung Electronics has crossed a $1 trillion market capitalisation.
This is not a gradual drift. This is a structural reordering of the global equity hierarchy — and it has happened in five months.
The Numbers in Full
| Country | ETF | YTD Return | 1-Year Return |
|---|---|---|---|
| South Korea | EWY | +106.39% | +234.53% |
| Taiwan | EWT | +60.77% | +90.63% |
| Norway | ENOR | +30.61% | +36.59% |
| Israel | EIS | +24.69% | +62.98% |
| MSCI EM | EEM | +25.02% | +48.31% |
| US S&P 500 | SPY | +10.07% | +26.97% |
| MSCI ACWI | ACWI | +11.56% | +26.93% |
| UK | EWU | +7.82% | +18.34% |
| Canada | EWC | +8.84% | +30.97% |
| Germany | EWG | +2.94% | +3.40% |
| France | EWQ | +2.07% | +6.99% |
EWY's +106.39% YTD is the largest year-to-date return of any country ETF in the database — by an enormous margin. EWT's +60.77% places it second. The MSCI ACWI has gained +11.56%. The divergence between these two AI chip-concentrated markets and every other country is not a matter of degree — it is a different order of magnitude.
Performance Comparison: EWY vs EWT vs SPY vs ACWI

Country ETF Tracker
- EWY
- EWT
- SPY
- ACWI
Trade iShares MSCI South Korea ETF EWY on eToro – the easy-to-use investing app with 7000+ assets.
Your capital is at risk.
Other fees apply.
Three Companies Behind Two Markets
The global equity map is not being redrawn by broad economic growth. It is being redrawn by three companies at the centre of the AI hardware supply chain — and the country ETFs that happen to contain them.
In Taiwan, the MSCI Taiwan Index is approximately 88% information technology, with TSMC alone representing approximately 57% of the benchmark. The iShares MSCI Taiwan ETF (EWT) carries TSMC at 19.80% of fund weight, alongside MediaTek (7.21%), Hon Hai/Foxconn (5.18%) and a full ecosystem of chip packaging, equipment and PCB manufacturers. Taiwan's total stock market capitalisation exceeds $4.95 trillion — the majority of which is TSMC's.
In South Korea, the MSCI Korea Index is approximately 61% IT, with Samsung Electronics (005930.KS) and SK Hynix (000660.KS) together representing approximately 54% of the benchmark. The iShares MSCI South Korea ETF (EWY) carries SK Hynix at 27.48% and Samsung at 23.78% — a combined weight of 51.26% in just two securities. The AUM of EWY has expanded to $22.65 billion as global capital has flooded into Korean AI exposure.
| ETF | Top AI Holdings | Combined Weight | AUM |
|---|---|---|---|
| EWY | SK Hynix (27.48%) + Samsung (23.78%) | 51.26% | $22.65B |
| EWT | TSMC (19.80%) + MediaTek (7.21%) + Foxconn (5.18%) | 32.19% | $10.17B |
The distinction between the two markets is analytically important. Taiwan's rally is fundamentally a one-company story. TSMC manufactures virtually all the world's sub-3nm logic chips — Nvidia's GPUs, Apple's processors, AMD's CPUs. It accounts for over 40% of Taiwan's total equity market cap. Taiwan's export orders rose nearly 66% year-on-year in March 2026, hitting an all-time high. TSMC's Q1 2026 revenue reached $35.9 billion at a 66.2% gross margin — both above the high end of its own guidance.
South Korea's rally is broader. Samsung reported all-time-high quarterly revenue of approximately $89 billion in Q1 2026, with its Device Solutions division — covering memory, foundry and system chips — posting $54 billion alone. SK Hynix posted record quarterly revenue of approximately $35 billion, citing surging demand for HBM. But analysts note that even stripping out Samsung and SK Hynix, South Korean corporate earnings are growing at 40-45% this year — driven by defense contractors, shipbuilders, power equipment manufacturers and the "K-culture" consumer export theme. Korea is a concentrated AI play with meaningful diversification below the headline names.
What Is HBM — And Why It Matters
The specific product driving South Korea's outperformance is High Bandwidth Memory (HBM) — a specialised form of DRAM that is stacked vertically and packaged adjacently to the GPU die inside AI accelerators. Every Nvidia GPU ships with 6-8 stacks of HBM modules, each of which must be manufactured by either SK Hynix or Samsung (with Micron as a third, smaller competitor).
As AI models have scaled from billions to trillions of parameters, memory bandwidth has become the binding constraint on AI computation speed. The GPU cannot calculate faster than it can move data in and out of memory. HBM — which is orders of magnitude faster than conventional DRAM — has become essential, not optional, for AI training and inference at scale.
The commercial consequence is a pricing regime shift that the market is only beginning to price. HBM contracts, which previously ran on 3-6 month terms, are now being signed on 3-5 year cycles as hyperscalers lock in supply well in advance. Samsung and SK Hynix have unprecedented multi-year pricing visibility — a structural change from the commodity cyclicality that defined the memory industry for decades. The market is repricing Korean memory stocks from "commodity cyclical" to "structural AI infrastructure" — and the multiple expansion from that repricing is what drives EWY's +106%.
The Hyperscaler Fuel
The demand pull behind both Taiwan and Korea's rally has a common origin: US hyperscaler AI capital expenditure. Microsoft, Google, Amazon and Meta are collectively on track to spend approximately $720 billion in AI infrastructure capex in 2026 — up from roughly $415 billion in 2025, a 74% annual increase. Virtually all of that capex flows into data centres. Data centres require Nvidia GPUs. Nvidia GPUs require TSMC to manufacture the logic dies and SK Hynix or Samsung to supply the HBM. The capital chain from Silicon Valley balance sheets to Taiwanese and Korean factory floors is direct and uninterrupted.
The supply constraint amplifies the commercial impact. TSMC's most advanced nodes are sold out through 2027. SK Hynix's HBM production is allocated multiple quarters in advance. When supply cannot expand quickly enough to meet demand, pricing power accrues to the incumbent suppliers — and earnings grow faster than revenue.
Country ETF Performance vs Energy Trade Balance
Correlation: 0.000 | Since 2026-02-27
Valuation: The Great Divergence
The performance gap between EWY and EWT extends to their valuation profiles — with striking results.
| Market | ETF | Fwd P/E | vs ACWI | YTD Return |
|---|---|---|---|---|
| Taiwan | EWT | 20.97x | +16.1% | +60.77% |
| MSCI ACWI | ACWI | 18.07x | — | +11.56% |
| UK | EWU | 12.79x | -29.2% | +7.82% |
| Canada | EWC | 16.38x | -9.4% | +8.84% |
| South Korea | EWY | 7.51x | -58.4% | +106.39% |
The EWT-EWY valuation divergence — 20.97x versus 7.51x — has not narrowed despite EWY's +106% YTD return. EWY has doubled in price but its forward earnings have more than doubled simultaneously. Samsung's all-time-high revenue and SK Hynix's record quarterly earnings are expanding the denominator of the P/E ratio as fast as the stock price is rising — or faster. At 7.51x forward earnings, South Korea remains one of the cheapest AI-exposed markets in the world despite its extraordinary price performance. Taiwan at 20.97x is priced for premium — but is still below US valuations (SPY: 21.50x) despite being classified as an Emerging Market.
The contrast with the markets being displaced — the UK at 12.79x, Canada at 16.38x — is instructive. Both are more expensive than Korea on a forward P/E basis, yet both have dramatically underperformed in 2026. Valuation alone did not predict the ranking change. The composition of the listed equity universe — AI chip exposure versus financials/energy/resources — was the determining variable.
Who Is Being Left Behind — And Why
The countries losing ground in the global equity hierarchy share a common structural characteristic: their listed equity markets are anchored in the industries of the previous economic cycle.
United Kingdom (EWU, +7.82% YTD): Information technology represents approximately 1% of the MSCI UK index. Financials, healthcare, consumer staples, industrials and energy dominate. The UK equity market has structurally failed to retain high-growth technology companies — the most prominent example being Arm Holdings, which chose a US-only Nasdaq listing in 2023 rather than London, in a move widely seen as a verdict on the London market's attractiveness for technology listings.
Canada (EWC, +8.84% YTD): IT accounts for less than 10% of the MSCI Canada index. Financials, energy, materials and industrials dominate. Canada's equity market is structurally oriented toward the commodity and banking sectors that powered the 2010s cycle — not the AI infrastructure theme driving 2025-2026.
Germany (EWG, +2.94% YTD): Exposed to the structural headwinds facing legacy auto manufacturers (Volkswagen, BMW, Mercedes-Benz), chemical companies (BASF) and traditional industrials in a weak domestic demand environment.
The global equity ranking is, in 2026, a near-perfect proxy for each country's exposure to the AI hardware supply chain. Countries that host companies in that supply chain are rising. Countries that do not are being displaced.
The Concentration Risk — The Lesson From Denmark and Saudi Arabia
The same CNBC analysis that documented Taiwan and Korea's ascent also flagged the cautionary precedent: Denmark and Saudi Arabia were among the worst-performing global equity markets in late 2025, precisely because of the same concentration dynamic now powering Taiwan and Korea.
Denmark's MSCI index was dominated by Novo Nordisk and its exposure to the GLP-1 obesity drug cycle. When Novo Nordisk faced competitive headwinds and its stock fell, Denmark's entire equity market fell with it. Saudi Arabia's MSCI index is dominated by Saudi Aramco. When oil prices declined in 2025, Aramco's stock dragged the entire Saudi market lower.
The message is analytically direct: concentration amplifies returns in both directions. TSMC at 57% of Taiwan's benchmark means Taiwan rises faster than any diversified market when TSMC is winning — and falls faster when it isn't. Samsung and SK Hynix at 54% of Korea's benchmark creates the same dynamic for HBM demand.
The specific risks analysts have identified for both markets:
- Political capex risk: Any reduction in hyperscaler data centre construction would reduce GPU demand, which would reduce HBM demand and TSMC fab utilisation simultaneously.
- Technology disruption: Six or more private US companies are developing alternative chip architectures. If any achieve a configuration shift — moving away from the current TSMC logic + Samsung/SK Hynix HBM architecture — the incumbent positioning of all three companies would be challenged.
- Cross-strait geopolitical risk (Taiwan): The most severe tail risk for EWT. Any escalation of China-Taiwan tensions would produce an immediate, severe market impact that no AI earnings thesis can offset.
How Far Can This Go?
Analyst consensus on the Korean market has been repeatedly revised upward in 2026. The KOSPI target progression — from 6,400 to 7,000 to 8,000 and now to 9,000, with some analysts citing 10,000+ as plausible — reflects a market that has consistently outrun forecasts.
The bullish case is arithmetically defensible: if AI model parameter counts continue scaling from trillions to tens of trillions, memory bandwidth requirements increase proportionally. HBM demand has no visible ceiling in that scenario. Samsung and SK Hynix have locked in 3-5 year pricing contracts. The next generation of AI accelerators will require more HBM per GPU, not less. The earnings trajectory points structurally higher.
The risk is the assumption embedded in that scenario: AI infrastructure spending sustains. If hyperscaler capex decelerates — for any reason: regulatory, macroeconomic, technological, or due to a "ChatGPT moment" for a competing architecture — the earnings basis of the entire re-rating dissolves simultaneously in both Taiwan and Korea.
What is clear today is that EWY at +106% and EWT at +61% YTD are not finished stories. They are the first chapters of a realignment that CNBC's analysts described as "the perhaps delayed coming of age of the Asian stock markets." Whether the next chapter is another doubling or the correction that always follows concentrated rallies depends on whether the AI hardware buildout continues to accelerate — or meets its first real ceiling.
Track EWY and EWT live at countryetftracker.com. Full global valuation analysis at countryetftracker.com/valuation. Compare all country ETFs at countryetftracker.com/compare.
Frequently Asked Questions
Why has South Korea's EWY ETF more than doubled YTD in 2026?
EWY's +106% YTD return is driven by SK Hynix (27.48% of fund weight) and Samsung Electronics (23.78%), which together represent 51.26% of the fund. Both companies are the dominant global producers of High Bandwidth Memory (HBM) — the specialised DRAM stacked adjacent to GPU dies in AI accelerators. As AI model parameters scaled from billions to trillions and hyperscaler capex grew 74% to $720 billion annually, HBM demand has massively outpaced supply. SK Hynix and Samsung have repriced their contracts from 3-6 month to 3-5 year cycles, locking in multi-year pricing visibility. The market is repricing Korean memory from commodity cyclical to structural AI infrastructure — producing multiple expansion on top of record earnings.
How did Taiwan overtake India to become the world's 5th largest stock market?
Taiwan's stock market capitalisation reached approximately $4.95 trillion as of late May 2026, surpassing India's $4.92 trillion. The gain is almost entirely attributable to TSMC's share price appreciation — the company represents over 40% of Taiwan's total market cap and 57% of the MSCI Taiwan benchmark. TSMC reported Q1 2026 revenue of $35.9 billion at a 66.2% gross margin. As the only company capable of manufacturing chips at sub-3nm process nodes, TSMC's monopoly position in the AI chip supply chain has driven the entire Taiwanese equity market re-rating. Taiwan was ranked 9th globally in December 2025; it is now 5th.
What is the difference between EWY and EWT as AI plays?
Both ETFs provide AI supply chain exposure, but through different layers. EWT captures the logic chip layer: TSMC at 19.80% manufactures the GPU dies that power AI training. EWY captures the memory layer: SK Hynix and Samsung produce the HBM that GPU dies depend on to function. The two layers are complementary — every Nvidia GPU requires both TSMC's logic manufacturing and SK Hynix/Samsung's HBM. The key differences: EWT trades at 20.97x forward P/E (premium to ACWI), while EWY trades at 7.51x (58% discount to ACWI), despite EWY's superior 2026 performance. Korea also has meaningful non-semiconductor growth drivers in defense, shipbuilding and the "Value Up" corporate governance reform programme, giving EWY broader earnings support beyond the HBM thesis.