
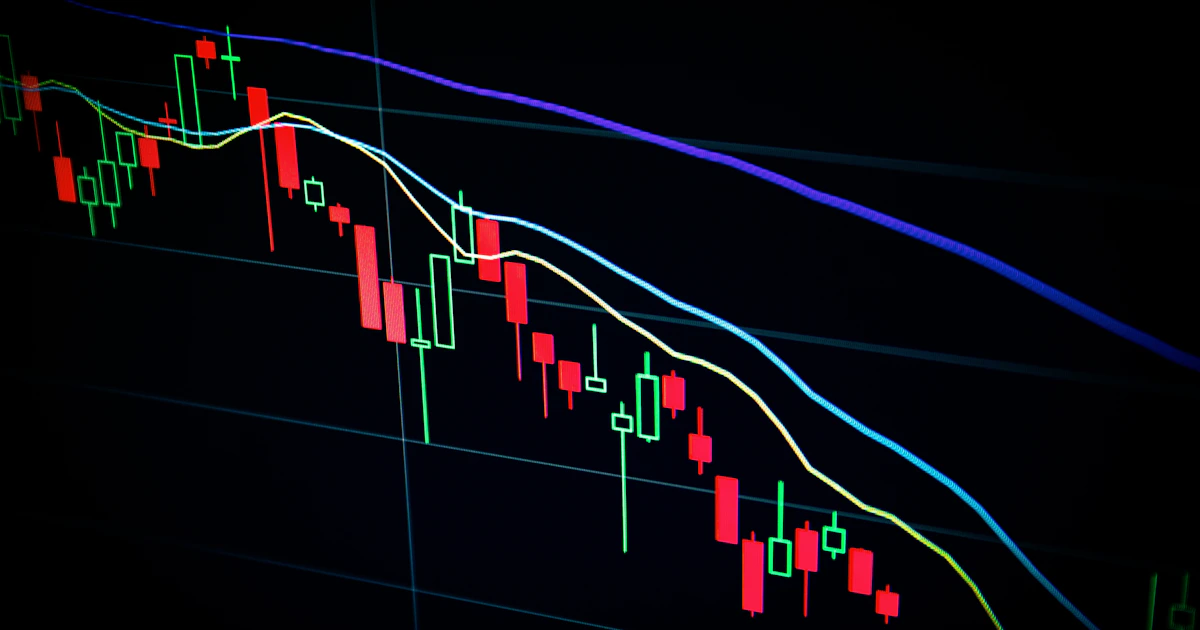
The S&P 500 has reached all-time highs. The SPDR S&P 500 ETF Trust (SPY) closed at $699.94 on April 15 — a new record — capping one of the fastest recoveries in the fund's history. From the ceasefire-day low, SPY has gained more than 10% in 11 sessions. A rally of this velocity — 15%+ in 11 sessions — has occurred only 15 times in SPY's full trading history since 1993.
The historical forward return profile of those 15 instances provides meaningful context for positioning:
| Horizon | Avg Return | Median | Win Rate | Max DD | Sharpe |
|---|---|---|---|---|---|
| 1 Month | +3.34% | +4.44% | 78.57% | -9.85% | 0.62 |
| 3 Month | +3.87% | +7.44% | 64.29% | -24.40% | 0.31 |
| 6 Month | +9.03% | +12.74% | 64.29% | -25.15% | 0.56 |
| 12 Month | +16.09% | +18.96% | 76.92% | -27.13% | 0.74 |
The 1-month (78.57%) and 12-month (76.92%) win rates are the two highest in the table. Historically, markets that recover this sharply do not immediately reverse — the first leg of the rally tends to extend at both the near-term and long-term horizon. The negative skew across all horizons (-0.59 to -0.16) reflects that when these recoveries do unwind, the drawdowns are large and fast.
What Just Happene
d
Just two weeks ago, IEA Chief Fatih Birol declared the world was facing "the largest energy supply disruption in modern history" — calling the Strait of Hormuz blockade "more serious than 1973, 1979 and 2022 combined." Twelve million barrels per day removed from global markets. A supply shock twice the scale of Ukraine.
In under two weeks, that thesis was fully dismantled. President Trump's two-week ceasefire with Iran, announced April 7, collapsed oil prices more than 15% in a single session, unwound rate hike expectations and sent SPY to record highs. Barron's ran: "How Markets Went from Iran War Angst to Watching for a New S&P 500 Record." JPMorgan strategists told Fortune that investors were "seeing through Iran volatility."
Prediction markets now price the US-Iran permanent peace deal at 73% by June 30 and 60% by May 31, per Polymarket data as of April 16. The Fed April meeting sits at 99.05% no change. US recession probability has fallen to 28.5% from 36% at the war's peak.
The Real Country ETF Data Since February 2
7
The table below uses the IranWar performance period — prices from the February 27, 2026 close (war start) through April 15, 2026. This is the only correct way to measure what the war and ceasefire did to country ETF returns.
YTD figures are misleading here: many ETFs entered the war having already gained 20-50% in January-February on the AI semiconductor boom. Measuring from December 31 conflates the pre-war rally with the war-period performance. The February 27 baseline isolates the war cycle cleanly.
Full ranking — February 27, 2026 close → April 15, 2026:
| ETF | Country | Since Feb 27 |
|---|---|---|
| KSA | 🇸🇦 Saudi Arabia | +9.31% |
| EIS | 🇮🇱 Israel | +7.29% |
| EWZ | 🇧🇷 Brazil | +7.05% |
| ENOR | 🇳🇴 Norway | +7.02% |
| EWT | 🇹🇼 Taiwan | +6.70% |
| EPOL | 🇵🇱 Poland | +6.16% |
| COLO | 🇨🇴 Colombia | +6.09% |
| TUR | 🇹🇷 Turkey | +4.85% |
| ARGT | 🇦🇷 Argentina | +4.60% |
| EWO | 🇦🇹 Austria | +4.46% |
| EFNL | 🇫🇮 Finland | +4.21% |
| EDEN | 🇩🇰 Denmark | +3.93% |
| ILF | Latin America | +3.48% |
| GREK | 🇬🇷 Greece | +2.42% |
| SPY | 🇺🇸 United States | +2.03% |
| EWS | 🇸🇬 Singapore | +1.88% |
| EWI | 🇮🇹 Italy | +1.50% |
| EWN | 🇳🇱 Netherlands | +1.35% |
| EWP | 🇪🇸 Spain | +0.98% |
| ACWI | Global | +0.96% |
| EWA | 🇦🇺 Australia | +0.56% |
| VT | Total World | +0.53% |
| EWC | 🇨🇦 Canada | +0.10% |
| KWT | 🇰🇼 Kuwait | -0.05% |
| QAT | 🇶🇦 Qatar | -0.31% |
| EEM | EM Broad | -0.61% |
| IEMG | EM Broad | -0.61% |
| ACWX | World ex-US | -1.29% |
| IDEV | Dev. Markets | -1.81% |
| EWU | 🇬🇧 United Kingdom | -1.81% |
| EWW | 🇲🇽 Mexico | -1.87% |
| EWM | 🇲🇾 Malaysia | -2.09% |
| VNM | 🇻🇳 Vietnam | -2.20% |
| GXC | 🇨🇳 China | -2.28% |
| EWD | 🇸🇪 Sweden | -2.43% |
| EWH | 🇭🇰 Hong Kong | -2.48% |
| FEZ | Eurozone | -2.74% |
| EWJ | 🇯🇵 Japan | -3.57% |
| EWQ | 🇫🇷 France | -3.63% |
| THD | 🇹🇭 Thailand | -4.12% |
| EWY | 🇰🇷 South Korea | -4.26% |
| INDA | 🇮🇳 India | -4.38% |
| EWG | 🇩🇪 Germany | -4.47% |
| ENZL | 🇳🇿 New Zealand | -5.11% |
| EWL | 🇨🇭 Switzerland | -5.30% |
| EIDO | 🇮🇩 Indonesia | -8.70% |
| EZA | 🇿🇦 South Africa | -10.66% |
| EPU | 🇵🇪 Peru | -11.69% |
Source: CountryETFTracker IranWar performance period. Base: February 27, 2026 closing prices. Current: April 15, 2026. All returns in USD.
| Country | ETF | Performance Since 2026-02-27Perf % | Energy Balance (% GDP)Energy |
|---|---|---|---|
| Loading... | |||
What the Data Actually Shows: Four Conclusion
s
1. The energy exporter thesis held — but modestly.
Saudi Arabia (KSA, +9.31%) and Norway (ENOR, +7.02%) are two of the top four performers since February 27, validating the core energy exporter argument. Both benefited from Brent above $100 during the war and have retained most of those gains post-ceasefire. But the magnitude is far smaller than the YTD narrative suggested: KSA outperformed SPY by only 7 percentage points across seven weeks — meaningful, not extraordinary.
2. South Korea (EWY) was a round trip.
EWY's +42.70% YTD return is almost entirely a pre-war phenomenon — built in January and February on AI semiconductor demand. From February 27, EWY is -4.26%. The war hit Korea hard in March (-18.74% in a single month on energy import shock), the ceasefire reversed most of those losses — but the net result across the full war-and-ceasefire cycle is slightly negative. The narrative of Korea as the great war-period loser was real in March; by April 15, it had fully unwound.
3. Taiwan defied the energy importer thesis.
Taiwan (EWT, +6.70%) is a major energy importer — it should have underperformed during the oil shock. Instead it is the fifth-best performer since February 27. TSMC's Q1 2026 earnings, released in April, showed AI data centre demand accelerating at a pace that overwhelmed the energy import cost headwind. Semiconductor earnings cycle > energy macro, for Taiwan specifically.
4. The real losers are commodity exporters — not energy importers.
Peru (EPU, -11.69%) and South Africa (EZA, -10.66%) are the two worst performers since February 27 — and neither is primarily an energy importer. Peru's losses reflect copper price weakness and domestic political risk. South Africa's reflect the collapse of precious metals (gold -12%, platinum -17%, palladium -20% at their worst during the war-period risk-off) as investors liquidated commodity positions into the oil shock. The war punished non-oil commodity exporters as severely as energy importers — a nuance the energy trade balance framework entirely missed.
Country ETF Performance vs Energy Trade Balance
Correlation: 0.000 | Since 2026-02-27
The Collapse of the Energy Exporter/Importer Narrativ
e
The war period (February 27 – April 7) appeared to confirm a clean binary: energy exporters win, energy importers lose. That framework organised market commentary for six weeks. The full data since February 27 through the ceasefire tells a more complex story.
The spread between the best country ETF (KSA, +9.31%) and SPY (+2.03%) is 7.3 percentage points. The spread between SPY and the worst country ETF (EPU, -11.69%) is 13.7 percentage points. Most of that spread has nothing to do with energy trade balance — it reflects copper prices, sovereign risk, currency dynamics and earnings quality. Colombia (+6.09%), Poland (+6.16%) and Argentina (+4.60%) — none with obvious energy narratives — all outperformed SPY significantly.
The framework that generated alpha during the acute war phase (February 27 – March 20) has ceased to be the primary driver since the ceasefire. The market has rotated back to fundamentals: valuation, earnings quality and currency.
What Polymarket Says About What Comes Nex
t
Prediction market data as of April 16, 2026:
Iran peace deal:
- Permanent deal by June 30: Yes 73%, No 27%
- Permanent deal by May 31: Yes 60%, No 40%
Hormuz:
- Traffic returns to normal by April 30: Yes 23.5%, No 76.5%
- Blockade lifted by April 30: 61%
The divergence is the key analytical signal: the market prices a 73% probability of a permanent deal by June 30 — but only a 23.5% probability that Hormuz traffic normalises by April 30. Peace is being priced ahead of physical normalisation. This sequencing creates a window where energy exporters (KSA, ENOR) retain their war premium for longer than the peace probability alone would suggest.
What Iran demands Trump might agree to:
- Unfreeze Iranian Assets: 41%
- Oil Sanction Relief: 36%
- Uranium Enrichment: 25%
- Hormuz Transit Fees: 8%
Economic concessions are the market's most likely path — structurally bullish for Iranian oil supply returning to market, and therefore bearish for the ENOR and KSA premium over time.
Macro backdrop:
- US recession by end-2026: 28.5% (down from 36% at the war's peak)
- Fed April meeting: 99.05% no change
- Fed rate hike in 2026: 14.5%
- Inflation above 4% in 2026: 51.5%
Three Country ETF Positions That Follow from the Dat
a
Germany (EWG, -4.47% since Feb 27) is the most analytically compelling developed market recovery case. At 13.70x forward P/E — a 19.98% discount to the MSCI ACWI — Germany's industrial complex (BASF, Siemens Energy, Thyssenkrupp) directly benefits from lower energy input costs as the ceasefire holds. German equities have underperformed across the full war cycle despite being among the cheapest markets in the developed world.
Switzerland (EWL, -5.30% since Feb 27) is the worst-performing developed market in the universe over the war period. Swiss equities entered the war richly valued (17.28x forward P/E, near fair value vs ACWI) and the franc's safe-haven premium compressed equity valuations further during the acute stress phase. Post-ceasefire, the case for Swiss reversion rests on the franc giving back its war-period appreciation.
KSA and ENOR: monitor for the deal. Both have retained their war-period gains (+9.31% and +7.02% respectively). If the 73% peace deal probability resolves to Yes with meaningful Iranian oil sanctions relief, Brent faces structural downward pressure from Iranian crude re-entering the market. The peace deal is the single largest risk to KSA and ENOR's current outperformance.
Full live performance data — including the IranWar custom period — at countryetftracker.com.
Frequently Asked Question
s
How rare is a 15%+ rally in 11 sessions for the S&P 500?
It has happened only 15 times in SPY's history since 1993. Forward returns across those instances show a 78.57% win rate at 1 month (avg +3.34%, median +4.44%) and 76.92% win rate at 12 months (avg +16.09%, median +18.96%). Historically, the first leg of these violent recoveries has extended rather than immediately reversed.
Why does EWY show -4.26% from February 27 when it is up over 42% YTD?
EWY's extraordinary YTD performance was built before the war started — in January and February, as AI semiconductor demand drove Samsung and SK Hynix to multi-year highs. From February 27 (the war-start date), EWY fell -18.74% in March on energy import shock fears, then partially recovered post-ceasefire. The net result from war-start to April 15 is -4.26%. The war period was a round trip for Korea. The YTD figure reflects the pre-war AI boom, not the war outcome.
Which country ETF performed best since the war started?
Saudi Arabia (KSA) leads at +9.31% from February 27 to April 15, followed by Israel (EIS, +7.29%), Brazil (EWZ, +7.05%) and Norway (ENOR, +7.02%). Taiwan (EWT, +6.70%) is the most analytically surprising — a major energy importer that outperformed most exporters on AI semiconductor earnings strength.
Why did the energy importer narrative fail for Taiwan but hold for India and Korea?
South Korea and India are primarily equity markets — their ETF returns are driven by broad market indices that reflect macro conditions (currency, rates, growth). Taiwan's ETF (EWT) is heavily concentrated in TSMC (approximately 21% weight), whose Q1 earnings showed AI demand overwhelming energy cost concerns. Sector concentration made Taiwan an outlier. India (INDA, -4.38%) and Thailand (THD, -4.12%) lack a comparable single dominant earnings story to offset the macro headwind.